
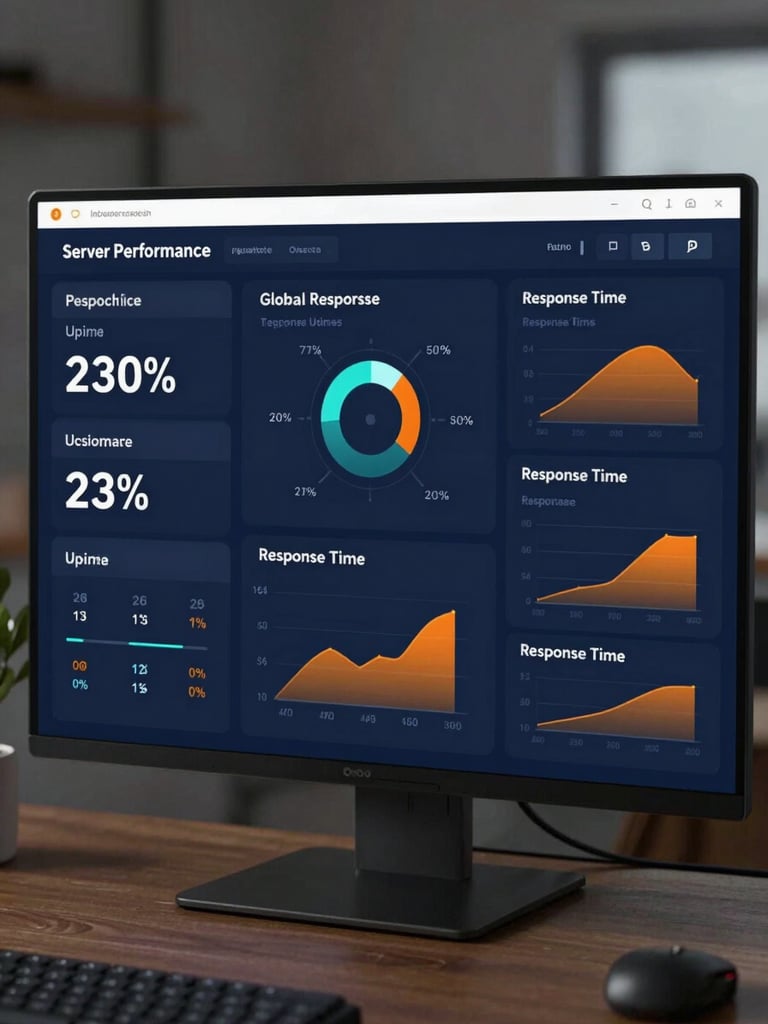
Real server performance data.
We purchase hosting plans anonymously, install standardized test suites, and monitor response times and uptime continuously. No marketing fluff, just raw telemetry.
Continuous automated monitoring.
Response Time
Uptime Decimal
Simulated Load
Continuous availability tracking down to three decimal places, capturing micro-outages ignored by standard monitors.
We ping test servers every 60 seconds from global nodes to measure exact Time to First Byte latency.
We flood servers with hundreds of concurrent virtual users to evaluate performance under sudden traffic spikes.
Independent hosting evaluations.
Apex Cloud
Stellar Shared
A high-performance developer platform optimized for static deployments and complex database workloads.
An entry-level provider featuring simplified control panels and automated daily backups for small sites.
Pros: Sub-100ms response times, integrated global CDN. Cons: Steep learning curve, high bandwidth overage fees.
Pros: Highly intuitive interface, 24/7 live support. Cons: Performance degrades under heavy concurrent load.
Starting at $4.00/mo
Starting at $2.95/mo
No paid placements. Ever.
We do not accept payments to alter rankings or hide poor performance. Our server monitors operate continuously, and the data speaks for itself.